Building a profitable trading strategy is the dream of every trader, but let’s be honest — most people don’t know where to start. The key to success lies in having a structured approach, one that allows you to catch monster altcoin moves and exit trades before big crashes.
Building A Profitable Trading Strategy
In this guide, I’ll walk you through a step-by-step process that will help you develop a winning trading system. I’ll even give you a free PDF at the end that you can use as a reference.
By the time you finish reading this, you’ll have the tools to:
Identify the right time to enter and exit trades.
Stay in winning trades longer, without panicking during pullbacks.
Avoid major losses by exiting at the right time during crashes.
Let’s break it down.
Phase 1: Maximum % Pullback Analysis
The first step in building your trading strategy is to analyze Maximum % Pullback data. This means collecting and journaling data from 30–100 trades to figure out how much price typically pulls back during an uptrend while still continuing its upward trajectory.
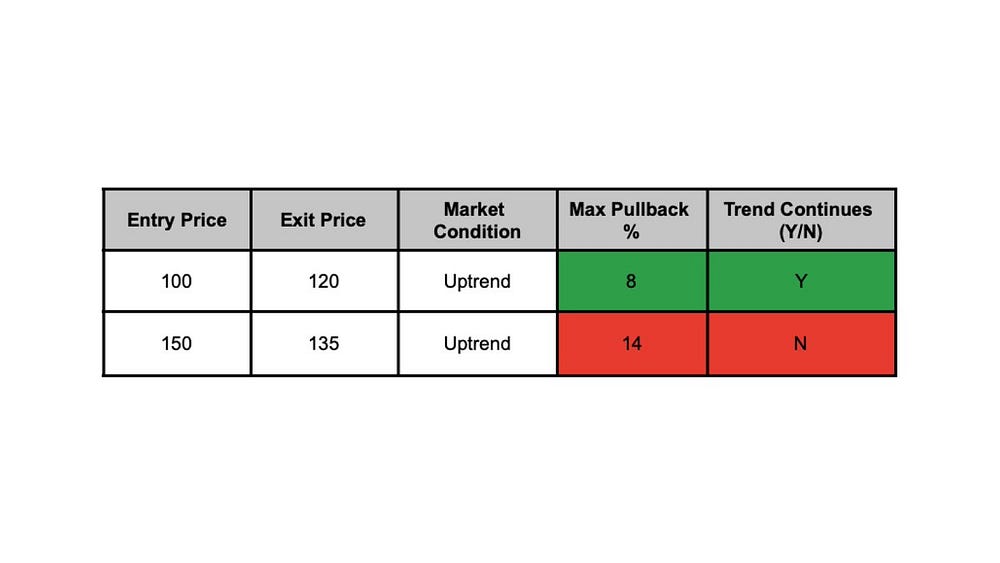
Here’s why this is so crucial: Many traders panic during a pullback and exit their trades too early, missing out on the rest of the move. By having data that shows you the average pullback percentage in an uptrend, you can make more informed decisions about when to stay in and when to exit.
How to get started:
Take a sample of 30–100 trades and journal them.
Track the maximum percentage that the price pulled back during each uptrend before continuing upward.
You’ll notice patterns in the data that are specific to your strategy. Maybe in altcoins, the average pullback is around 8–12% before the trend resumes.
Example:
Let’s say you tracked 50 trades. You found that, on average, BTC and ETH pull back 10% before continuing to trend up in bullish markets. This data will now serve as your guideline for when to hold and when to exit trades.
Phase 2: Decision-Making Process
Now that you’ve got the data, it’s time to put it to use. In this phase, you’ll create decision-making rules that will help you execute your trades consistently.
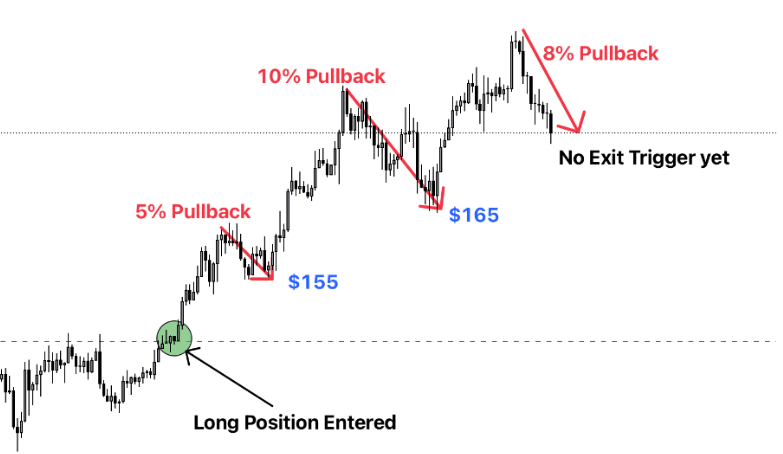
Let’s assume your data showed that the maximum pullback without breaking the uptrend is 10%. What this means is that if a price retraces more than 10%, it’s likely that the trend has broken, and it’s time to exit. But if the retracement stays under 10%, the trend is likely still intact, and you should stay in the trade.
Here’s how to structure your decision-making process:
If the pullback is greater than 10%, exit the trade.
If the pullback is less than 10%, stay in the trade. You don’t want to leave money on the table by exiting too soon.
Example:
You’re in a trade with ETH, and the price pulls back 8%. Your journal data shows that ETH often pulls back as much as 10% before resuming its upward movement. Because the retracement is less than 10%, you decide to stay in the trade, anticipating more upside.
This simple rule can make all the difference in staying calm during those nerve-wracking market dips. It removes the guesswork and gives you clarity.
Phase 3: Optimizing and Tracking Trades
Once you’ve got your decision-making process in place, it’s time to test it out on your next 30–100 trades. You’ll now track your trades with this specific rule in mind:
“I will only exit my longs if the price pulls back by more than 10%. Otherwise, I will stay in the trade.”
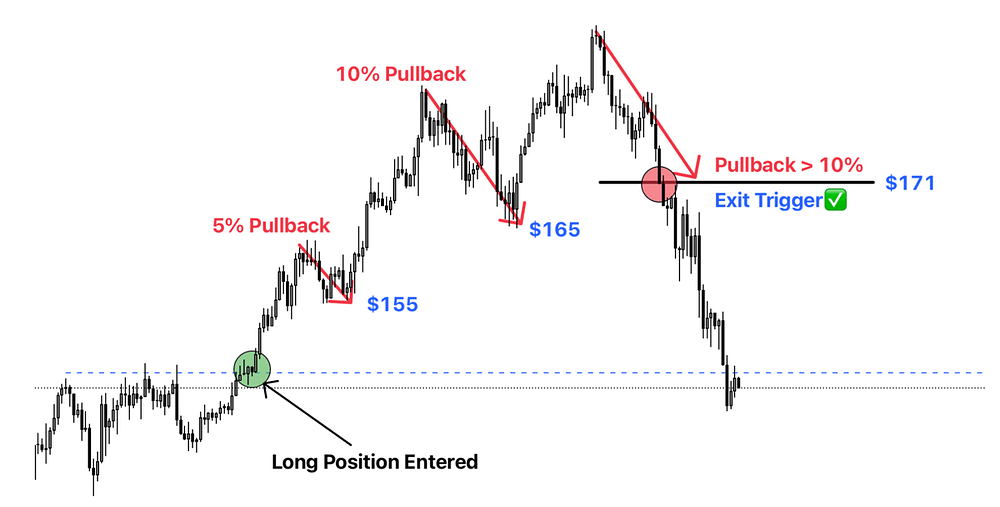
By following this rule, you’ll likely exit winning trades at higher points, as you’ll be staying in the uptrend longer. This method can also be applied in downtrends, where you can use the maximum % pullback in the opposite direction to maximize shorting profits.
Example:
Let’s say you entered a long trade at $50,000, and the price moves up to $58,000 before pulling back to $52,200 — a 10% pullback. According to your data, you should exit the trade here because the pullback has hit your maximum threshold. This way, you avoid sitting through a full reversal.
On the flip side, if the pullback is only 6%, you hold, knowing the uptrend is likely to continue. This allows you to capture more of the upside without exiting prematurely.
Why This Strategy Works
By using a data-driven approach, you eliminate the emotional aspect of trading. You now have a clear rule to follow, which removes the uncertainty of “should I hold or should I sell?” Your decisions are backed by real data from your own trades, making them more reliable than just following market sentiment.
This strategy also helps you avoid fear-based selling. Many traders panic when the market experiences a minor retracement, exiting their positions too early. With the right pullback data, you’ll know when to hold through these temporary dips and when to exit to protect your profits.
Recap: Creating a Profitable Trading System
Phase 1: Journal and collect pullback data. This will help you decide where to exit and how to stay in trades during pullbacks.
Phase 2: Implement decision-making rules. Use your maximum pullback percentage to determine whether to stay in or exit your trade.
Phase 3: Track and optimize your trades. Apply this rule consistently to stay in uptrends longer and maximize profits in downtrends.
This approach not only helps you catch big altcoin moves, but also lets you exit trades before a major crash hits. Over time, you’ll develop a structured process that is consistently profitable.
$BTC Weekly Trade Plan: My Trades, Key Levels, and Expectations
Here’s how I’m currently positioned, my trade ideas, and what I’ll be watching closely in the coming days:
Weekly Overview:
Let’s start with my higher time frame (HTF) view.
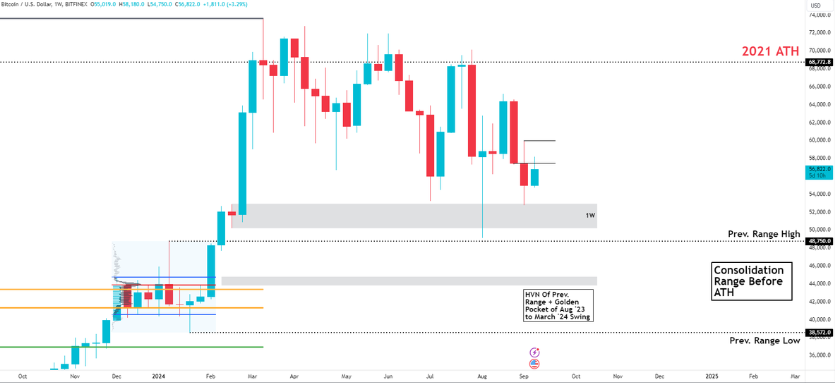
Spot Bids Filled at $53K: Last week, I placed spot buy orders at $53,000 as we were showing signs of forming a local bottom. Fortunately, those bids got filled, and we saw a 10% bounce. However, we couldn’t push past the previous weekly open, which is a sign of potential resistance in the short term.
Bias Last Week Was Bearish: Initially, I was leaning bearish with $53K acting as a crucial local bottom. I wasn’t expecting an immediate rebound, but I had plans to react either way, and the price action confirmed that $53K was the right level to watch.
Key Trade Levels:
The next critical area for me is between $59K to $59.9K. This zone is significant because it marks a key resistance area, and I’m watching for a possible rejection.
Another important level is around $52.5K. I’m looking for a sweep of this level before planning any longs.
I’m also keeping a close eye on a potential retest of the high-volume node (HVN) and the Golden Pocket (GP) around $45K. If BTC pulls back aggressively, this could be a great spot to re-enter longs.
Daily Time Frame:
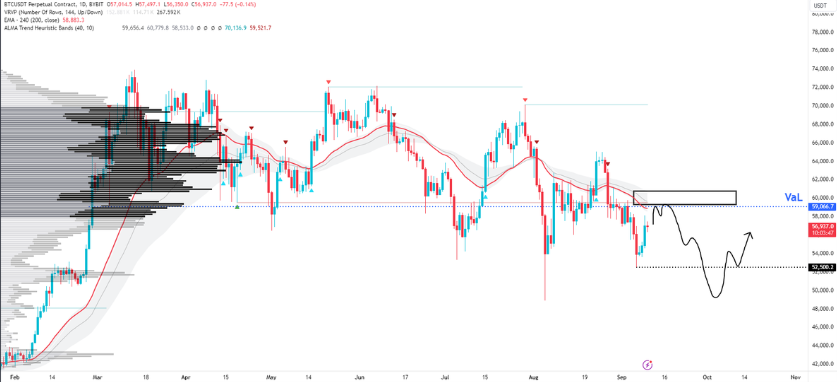
Moving into the daily, things get more granular. I like to watch how the price reacts to broader levels and potential zones of interest.
Approaching Value Area Low (VAL) at $59K: This level has been in play since March, and now we’re approaching it again. It has acted as a strong value area, and I expect it to continue playing an important role in BTC’s movements. The daily trend has been acting as resistance above this level, so my anticipation is for a possible rejection or at least a range around here.
Looking for a Rejection Around $59K: If BTC rejects at $59K like I expect, I’ll be looking for a range trade. I’ll likely look for opportunities to re-long on any sweeps lower. Right now, $59K to $61K is a no-trade zone for me. This is because it’s a low-volume area, and price tends to chop around this zone while everyone fixates on the psychological $60K number.
Example: A few weeks back, when BTC was hovering around $60K, we saw similar behavior where price oscillated between $59K and $61K, frustrating both longs and shorts. I don’t want to get chopped up in a similar scenario, so I’m staying out of trades in this range until I see clear direction.
4H Time Frame:
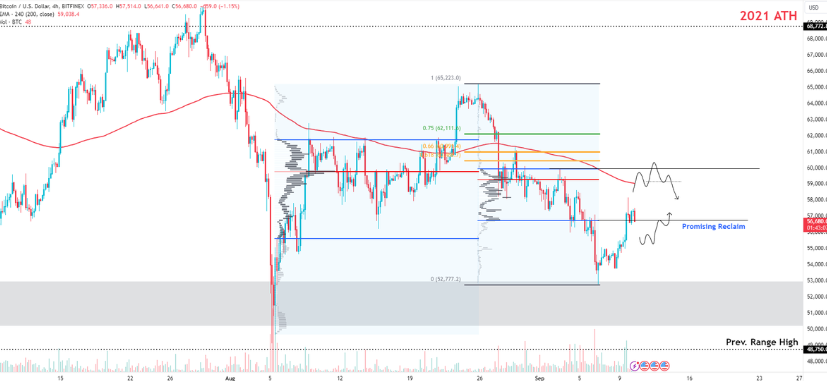
The 4-hour (4H) chart is where things get more tactical for me. It’s where I fine-tune my entries and exits.
Reclaim of $56.7K: This was the Value Area Low (VAL) of the previous swing, and we reclaimed it with solid volume — a bullish sign. I’m expecting price to push up toward the Value Area High (VAH) and Point of Control (POC) from the last swing, which is between $59.3K and $59.6K.
Close Below $56.7K: If we close below this level, I’ll consider a scalp short to play a potential retracement. However, if we lose the level but quickly reclaim it, I’ll be ready to enter a long trade.
Key Short Trigger at $59K: I’ll be watching for an immediate rejection around $59K, where the 4H 200 EMA also sits, creating a high-confluence zone for a scalp short.
Example: Back in early September, a similar reclaim and rejection happened at this level, leading to a 5% drop within hours. I’m keeping this example in mind as a template for my next move.
LTF (Low Time Frame) and Order Flow:
Now, let’s zoom into the lower time frames and look at what the order flow and intraday price action are telling me.
Monday Relief Bounce: Monday saw a bit of relief as we saw spot buying during the US session, likely driven by institutional players like ETFs. This helped lift the price but didn’t give us enough momentum to fully reverse the bearish sentiment.
Tuesday Dump: On Tuesday, we saw a sharp dump during the US Open — likely caused by spot TWAPs selling off their positions. This dump leads me to believe the market is still trending bearish, with only brief periods of ranging. Notably, perp longs started adding above $56K, but they were mostly late and aggressive, meaning they’re now stuck in offside positions.
Example: I saw a similar situation in late 2022, where perp longs piled in aggressively at key levels, only to get liquidated shortly after. I’m expecting something similar this time around, especially if the market continues to show weakness.
Political Impact: With the Trump vs Kamala Debate happening, I’m expecting some upside during the late US session. However, given that we’re showing signs of a local top, I’m cautious about entering longs right now.
Current Trades and Future Plans:
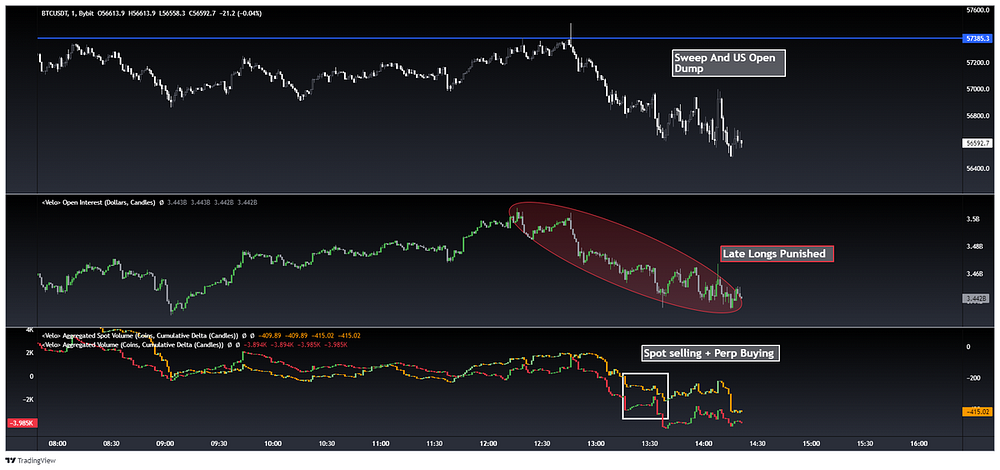
I entered a short near $57.1K, just before the US session kicked off, anticipating a sweep up. So far, it’s playing out, and I’m still holding and watching to see if the price action confirms my idea. [This is just a short term trade, im still bullish longterm!]
Future Plans: If BTC shoots up to my HTF levels near $59K, I’ll be looking for another short entry targeting the low $50K range again. My plan is to scale into these positions carefully, watching for volume confirmation and clear rejection signals.
Final Thoughts:
In summary, I’m staying nimble and flexible with my trades this week. $53K has been a strong level of support so far, and we’ve seen a solid 10% bounce. However, the bigger test lies ahead at $59K. I’ll be watching closely for rejections, retracements, and opportunities to scale in and out of both long and short positions.
As always, it’s all about playing the levels and letting the price action guide me. With clear plans in place, I’m confident that we can navigate these tricky ranges and come out on top.
Your next step
Stay tuned to my next issue, where I will continue to give my insights on crypto + entrepreneurship to financial freedom!
Follow me on twitter (@healthy_we44554) and threads (@wise.healthy.wealth)

