Everyone seems to think that $74K was the final stop for Bitcoin, as if we’ve reached the end of the road.
But I’m here to tell you that we’re far from done.
This isn’t the endgame — it’s just a mid-cycle correction.
Let me break it down for you by diving into five key on-chain indicators that show why $74,000 was definitely not the top for $BTC.
1. MVRV Z-Score
The MVRV Z-Score, or Market Value to Realized Value Z-score, is a crucial metric for identifying whether Bitcoin is overvalued or undervalued.
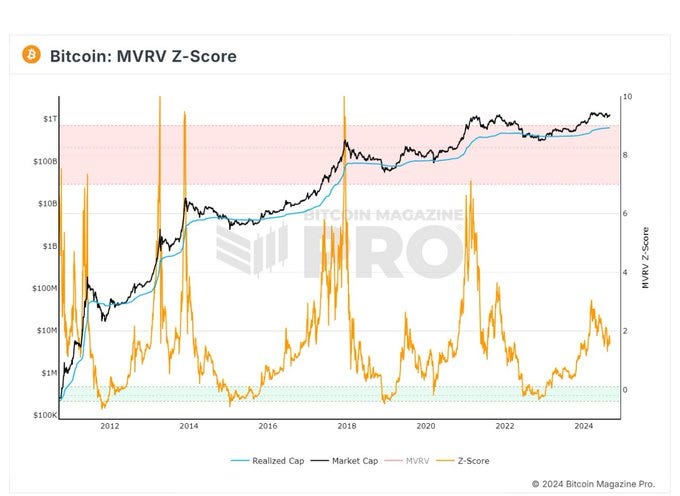
It calculates the difference between Bitcoin’s market value (the current price multiplied by the circulating supply) and its realized value (the price at which each Bitcoin was last moved, multiplied by the circulating supply).
Historically, whenever the MVRV Z-Score exceeds 7, the market has entered an euphoric phase, signaling that a market top might be near. However, right now, the MVRV Z-Score is only at 1.77.
Even during the peak in March 2024, it only reached 3.03 — well below the levels seen during previous cycle tops. This tells us that we’re not even close to the kind of overvaluation that typically precedes a market top.
2. Net Unrealized Profit/Loss (NUPL)
Net Unrealized Profit/Loss (NUPL) estimates the total paper profits or losses held by Bitcoin investors.
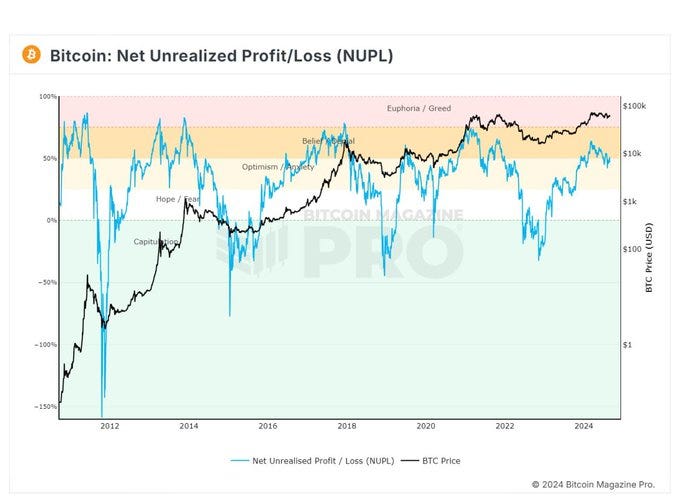
It gives us insight into market sentiment — whether investors are holding onto unrealized gains or losses. Historically, when this metric hits 75% or above, it’s often a signal to sell, as the market is likely reaching a peak.
In March 2024, NUPL reached 62%, and as of now, it’s sitting at 50%. This indicates that while there’s been significant profit-taking, the market hasn’t reached the levels of euphoria seen at previous tops.
We’re in the middle of the cycle, not at the end, suggesting that there’s still plenty of room for growth.
3. Puell Multiple
The Puell Multiple is another key indicator that looks at the supply side of Bitcoin, particularly focusing on miners and their revenue.
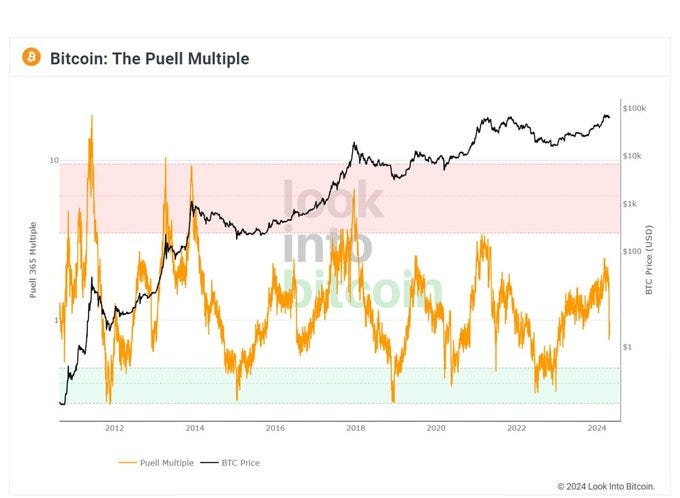
It’s calculated by dividing the daily issuance of Bitcoin (in USD) by the 365-day moving average of daily issuance value.
Historically, when the Puell Multiple exceeds 3.5, it signals a market top, as miners might start selling off their Bitcoin, increasing supply.
But right now, the Puell Multiple is below 1, indicating that we’re far from a sell signal. This is a strong sign that the market has not reached its peak and that there’s still considerable upside potential.
4. Rainbow Price Chart Indicator
The Rainbow Price Chart Indicator is a tool used to identify market sentiment across Bitcoin’s cycles, from periods where Bitcoin is considered “cheap” to times when it’s in a “bubble.”
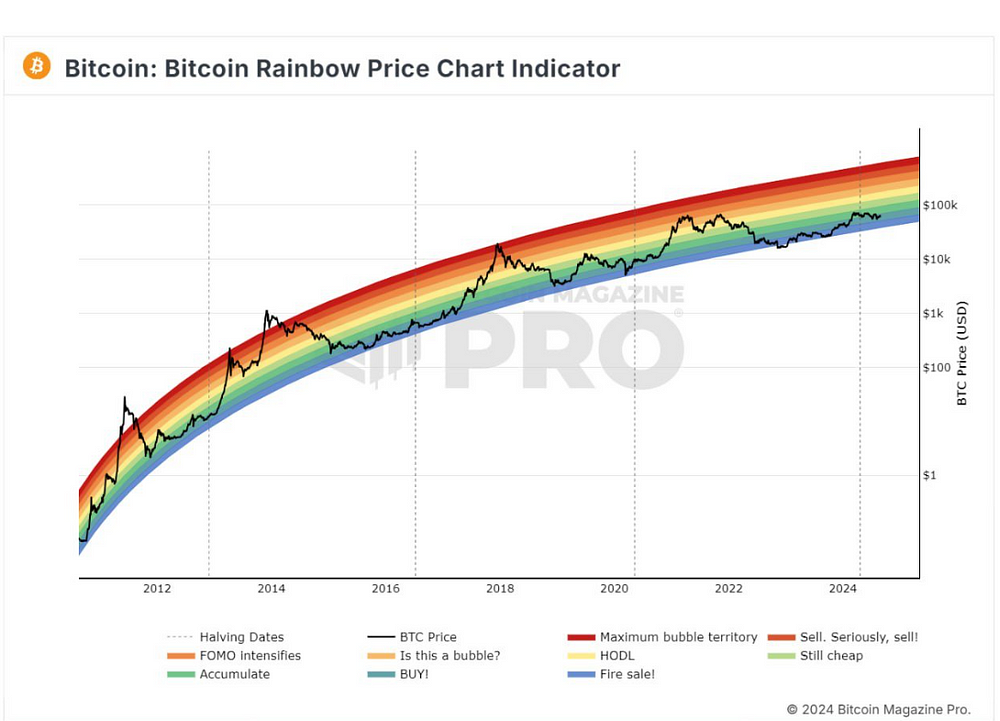
Each cycle top in Bitcoin’s history has occurred when Bitcoin has reached at least the “FOMO” stage on this chart.
Currently, Bitcoin is still in the “Buy” range, far from the “FOMO” and “Bubble” stages. This suggests that there’s still a lot of upside potential left in this cycle. We’re not in the late stages where caution is warranted; instead, we’re in a phase that historically precedes significant gains.
5. Pi Cycle Top Indicator
The Pi Cycle Top Indicator uses the 111-day moving average (111DMA) and a multiple of the 350-day moving average (350DMA × 2) to predict market tops. In 2013, 2017, and 2021, Bitcoin topped out when the 111DMA crossed above the 350DMA × 2.
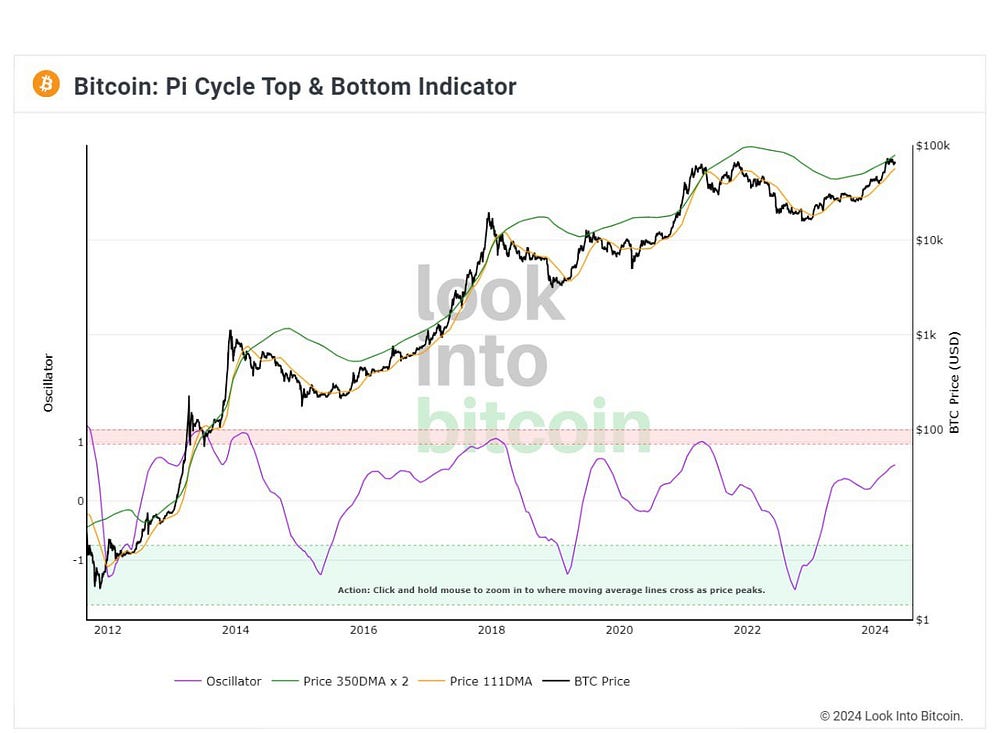
In this current cycle, that crossover hasn’t happened yet, which strongly suggests that Bitcoin has not yet reached its cycle top. This is another clear indication that we’re still in the midst of a mid-cycle correction rather than at the end of the road.
The Bigger Picture: Why This Is Just a Mid-Cycle Correction
These five indicators make it clear that Bitcoin is not done with its current cycle. What we’re seeing now is a healthy mid-cycle correction — a necessary phase that occurs in every cycle before the final leg up. But this isn’t just about looking at indicators; it’s about understanding the broader market dynamics and the stages that every crypto cycle goes through.
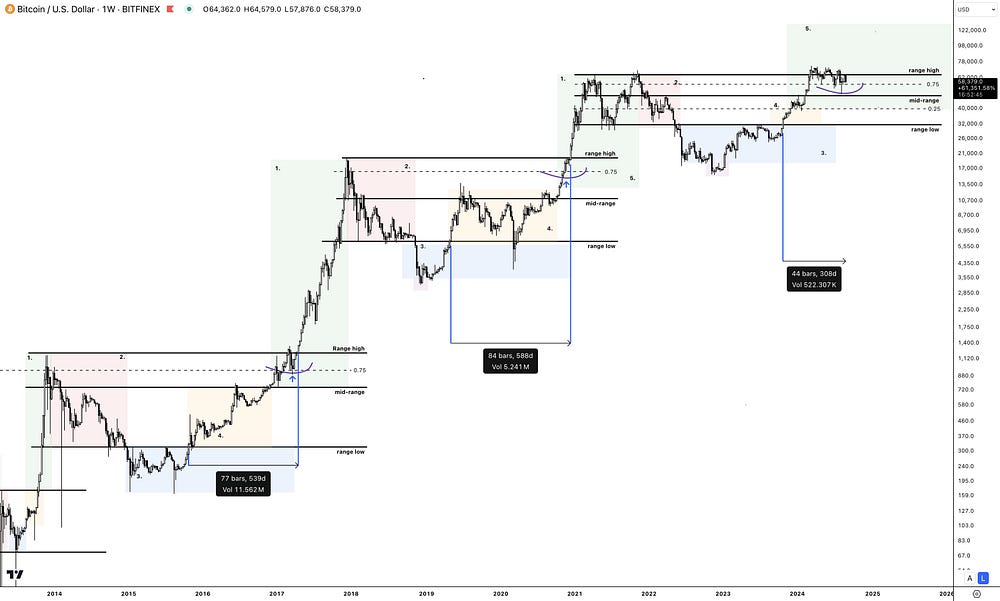
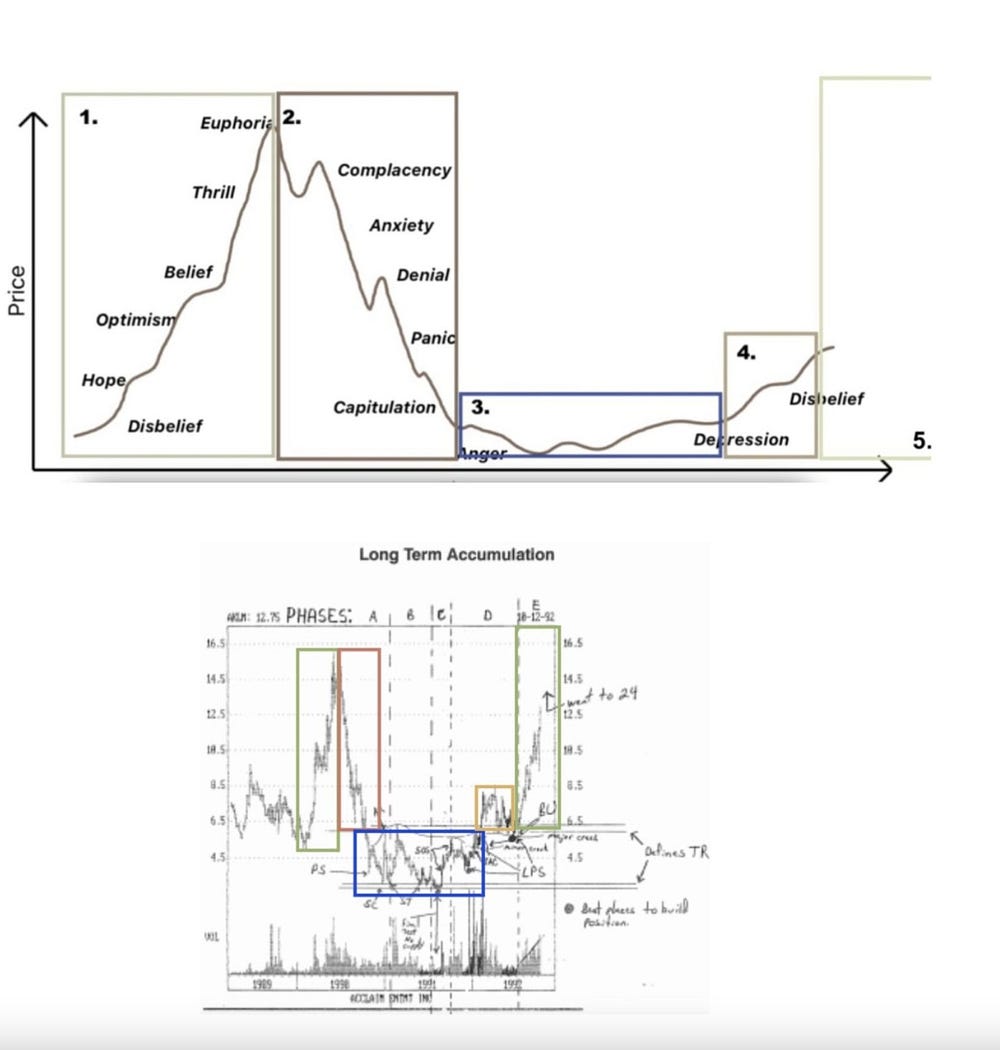
I always view the crypto market in cycle stages, combining this understanding with a simple higher time frame (HTF) range format:
Stage 1: Bull Market — The market forms the next cycle range.
Stage 2: Bear Market — The initial low sets the range low.
Stage 3: Accumulation/Sideways — The price drops below the range, prints a deviation.
Stage 4: Initial Higher High/Disbelief — The market reclaims the previous range.
Stage 5: Parabolic Phase — The price rallies towards the range high and eventually breaks above it.
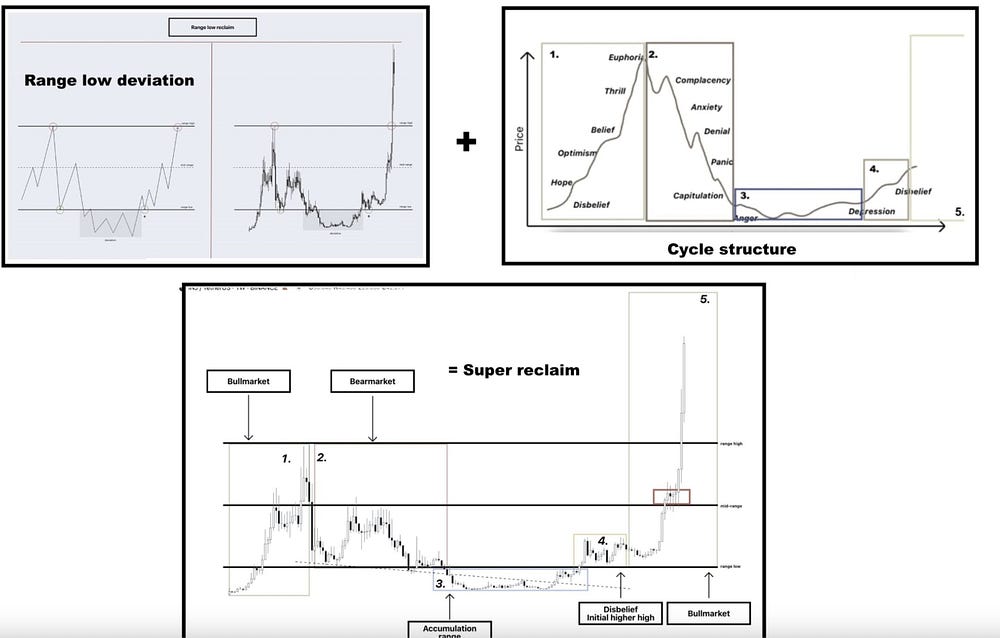
Bitcoin has consistently followed this pattern on higher time frames, and this cycle is no different. So, why am I not worried about the current consolidation?
1. Time Is on Our Side
In previous cycles, it took 409 and 560 days to reach the range high after reclaiming it.
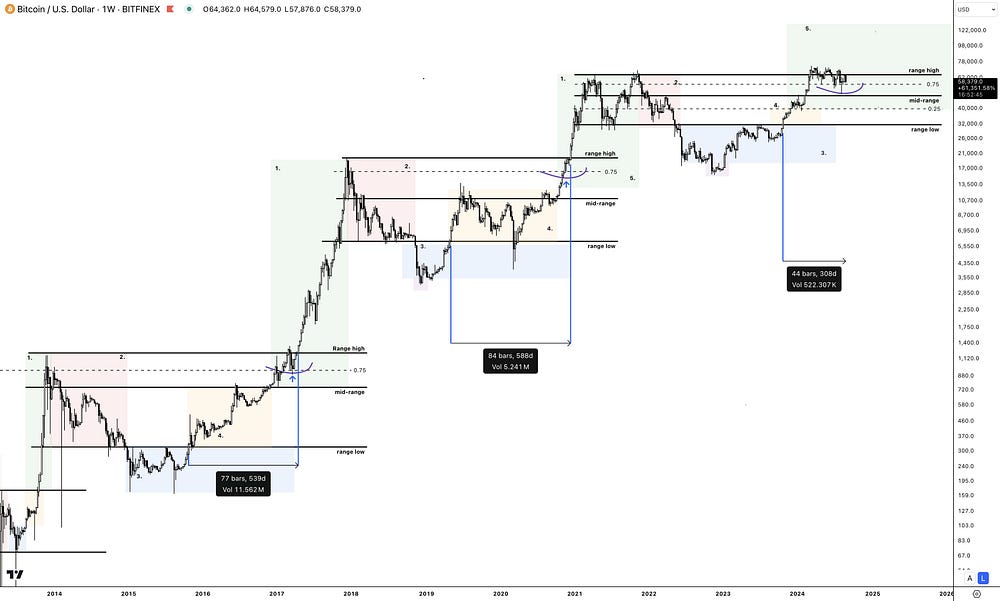
This cycle, it only took 125 days — an unusually fast rally. Given this quick rise, some consolidation is expected and healthy. As we stand, we’re only 300 days into this range, whereas previous cycles took 500–600 days to break out.
2. Halving and Range High Break
The Bitcoin halving typically brings about consolidation, as does a range-high breakout. This time, the halving coincided with hitting the range high resistance. The lack of cool-down periods during the rally is another reason why I’m not worried about this consolidation phase. It’s a natural part of the cycle, and if anything, it’s bullish, setting us up for enormous continuation at some point.
3. Understanding the Chop
There’s been a lot of chop in the market — 180 days of failed breakouts and downs. Yet, people are still betting with leverage on every small rally, hoping it’s the real breakout.
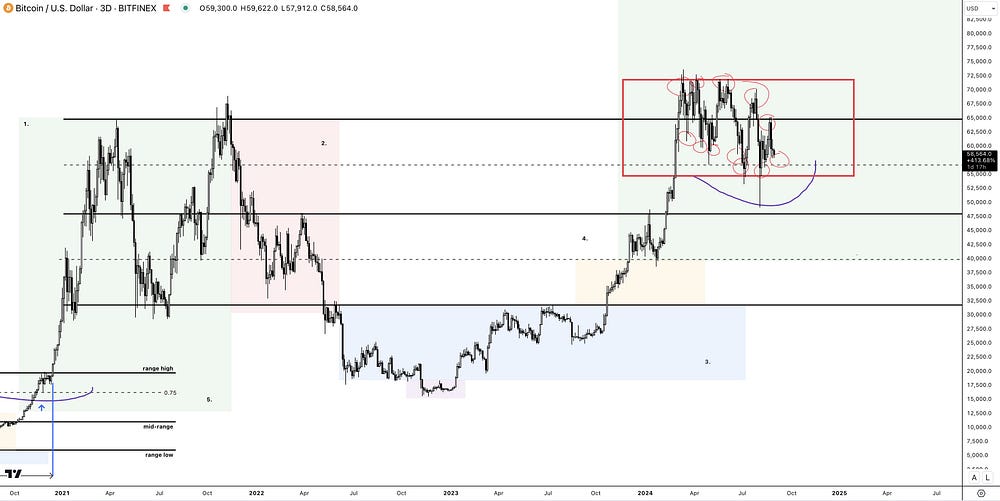
This is a recipe for getting chopped out of your funds before the actual move happens.
My approach has been different. I’ve been positioned in the market since 2023, mostly with spot positions. I took profits during the initial rally in 2024 and added more during the initial 0.75 range retests this year. Now, I’m waiting for either a breakout of this range or a breakdown to key levels like 0.25.
My Current Position: React, Don’t Predict
As long as we’re in this range, I assume we will continue to range and accumulate for a future breakout.
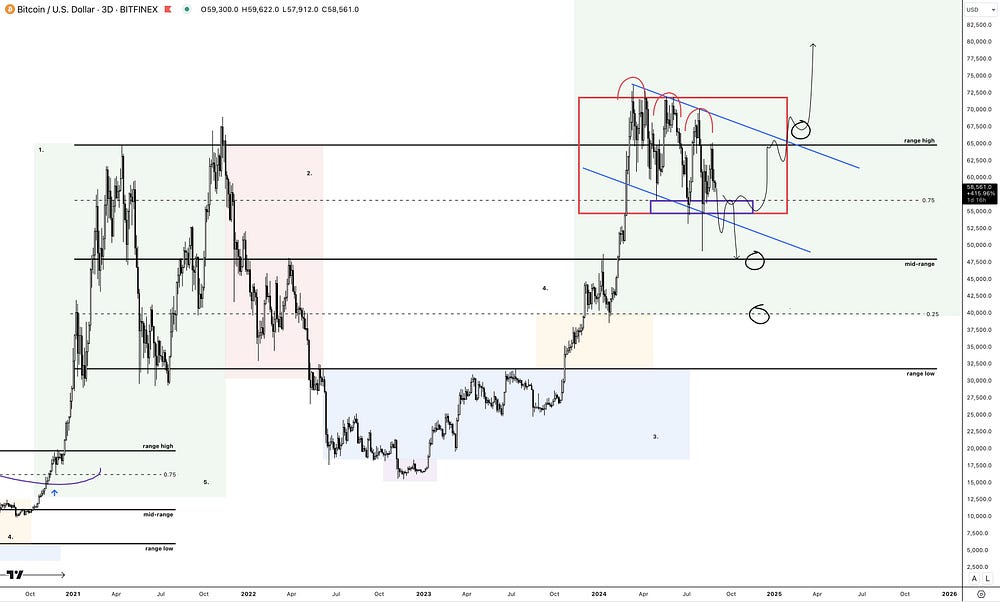
However, it’s essential to stay open to the possibility of a breakdown and have a plan ready. If we break down from here, I’ll stay macro bullish but patient on the medium time frames until I see what I want to see:
A reclaim of the lost consolidation — The most bullish option for the medium time frame.
A mini-cycle forms within the bigger cycle and range — Similar to what happened with $AGIX after rallying into the range high.
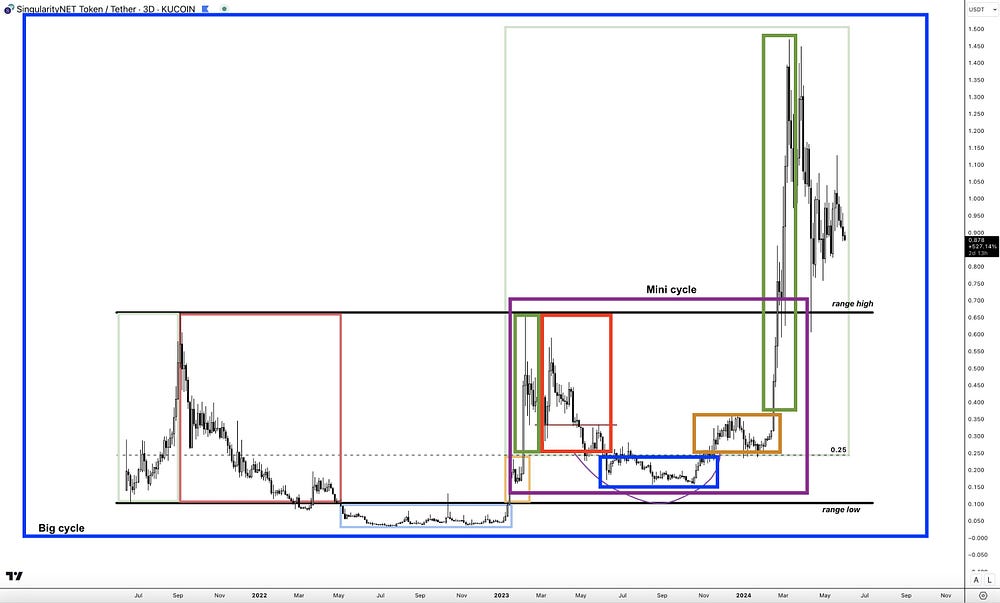
This approach allows me to remain flexible and avoid getting caught in predictions. Instead, I react to what the market gives me, waiting for the right price action before making any significant moves.
TL;DR: The Bitcoin Outlook
Still bullish on the cycle.
Assuming continuation from the current range.
Already positioned and waiting for a breakout or dips into key levels.
Will not blindly bid on a breakdown but instead wait for the right price action.
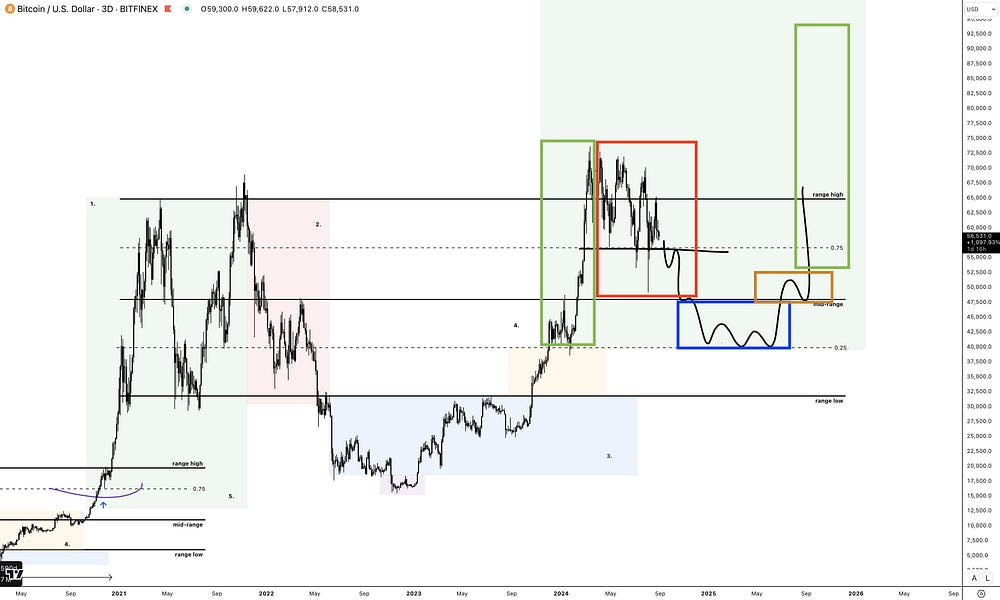
Will react and not try to predict. Also, if we do break down, we will watch the key levels (0.5 and 0.25) for a mini-cycle stage 3->4 break out. This is just an example of what it could be like. It could look drastically different. I’ll watch the key levels at 0.5 and 0.25 and react instead of predict by waiting for stages 3 and 4 to form.
Altcoins: The Second Part of the Bull Market
I’m a big Bitcoin bull, but I’m even more bullish on altcoins at their current levels.
The cycle and range structure for altcoins suggest that now is the time to accumulate, especially in the yellow box of Stage 4 (after the initial higher high) and sell during the parabolic move in Stage 5.
Currently, altcoins are in the yellow disbelief phase, close to the range low. It’s the darkest period before the fun starts, with many altcoins still trading near bear market levels. But this also offers the best risk/reward opportunities.
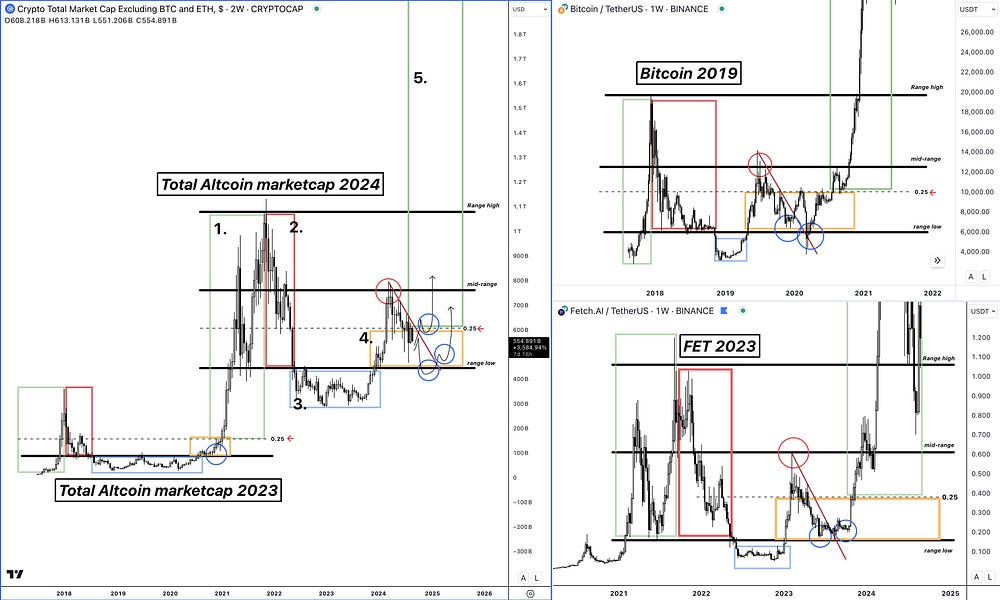
The Altcoin Playbook
Extremely bullish on altcoins at current levels.
Look for dips at the range low or after a trend line breakout and reclaim of 0.25.
Altcoins usually lag behind Bitcoin and only start their parabolic phase when Bitcoin breaks into new highs, which hasn’t happened yet.
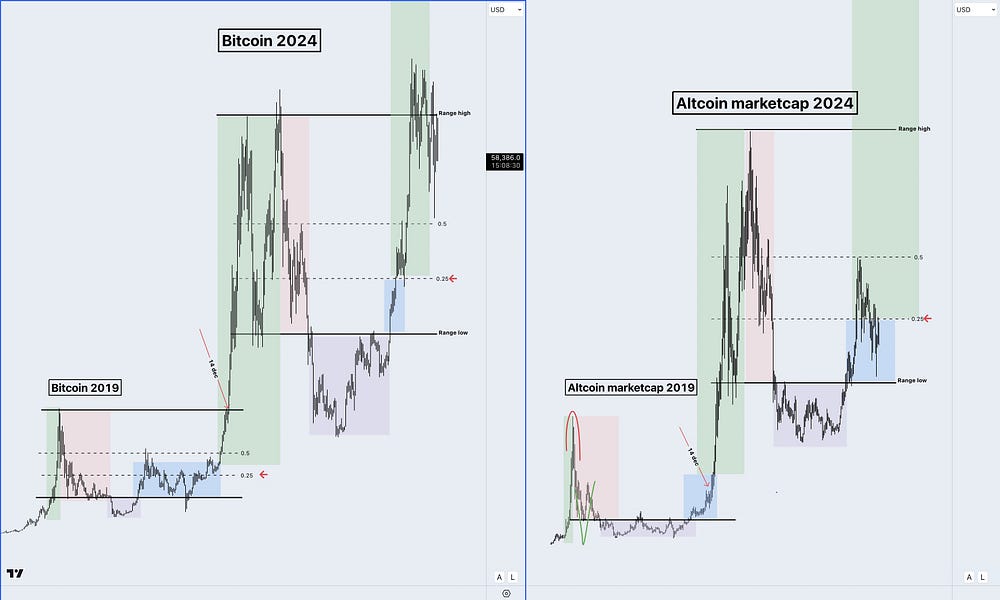
In conclusion, the current market conditions for both Bitcoin and altcoins are setting the stage for significant upside potential. While it might seem like the end for some, I see it as a critical mid-cycle correction that is healthy and necessary for the market’s long-term growth. The key is patience, discipline, and the ability to react rather than predict. Stay focused, and don’t let the noise distract you from the bigger picture.
Not every cycle plays out the exact same way. Sometimes there are bumps in the road. Sometimes things go faster and sometimes things go slower. I see this cycle being the the same but also highly different.
We had both the speculation from the ETF and the actual positive performance of inflows drive Bitcoin’s price higher earlier than ever before (pre-halving).
We had a mini version of an altseason pre-halving because the halving itself was a lot more well known than the past.
We are consolidating longer at the previous highs than before as well (likely a consequence of going up sooner than ever before). There are key differences and newbies have a tough time navigating through it as a result. But many things are also exactly the same:
BTC on its way and actually still on schedule to go way higher.
The overall structure on the altcoin market charts are very much the same as previous cycles around this time.
Bitcoin dominance is also at very similar heights at this time of the year. Basically 2024 is in a lot of ways like 2016 and 2020. The problem that makes this extremely hard for most is because they look at every cycle as the ultimate blueprint to the exact same day.
Even when the story starts and ends the same, it isn’t allowed to be different in the middle. (in reality it has to be like this) Zoom a bit out, be open to different scenarios and be adaptable.
All I’m looking at current is the fact that: “The longer the accumulation the higher the expansion” The early run made the current consolidation longer but it’s also going to make it stronger.
My current BTC thoughts — The other side of the coin
Let me walk you through something that has caught my attention recently — a scenario that could offer a powerful opportunity for those looking to long Bitcoin around the $44K level.
This setup, if it plays out, could lead to a significant high-time-frame (HTF) reversal, similar to what we’ve seen in previous market movements. Here’s why this level is so crucial and what it could mean for the broader market.
Why $44K Matters: Two Key Reasons
1. The HTF Fair Value Gap (FVG)
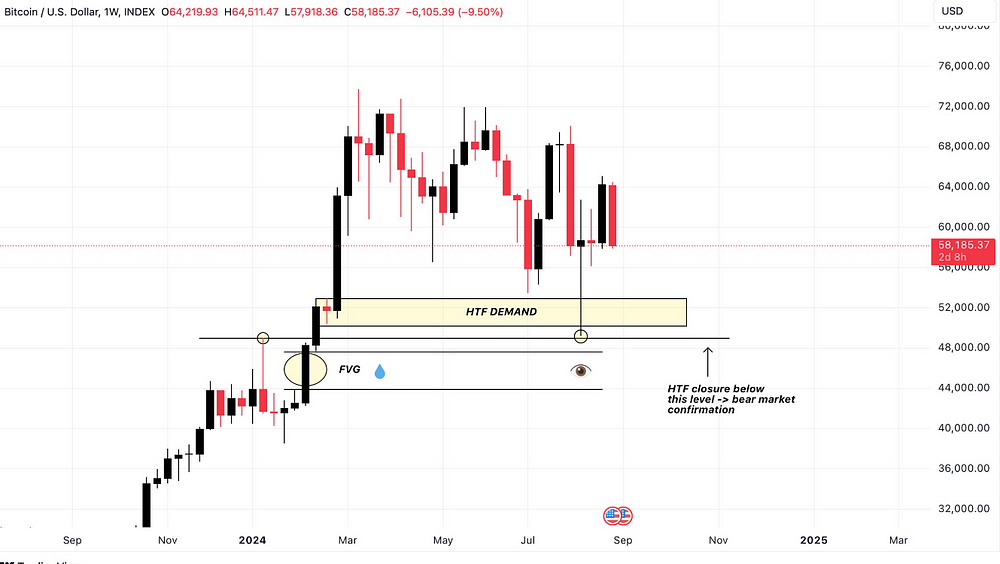
The first reason $44K is important is tied to the HTF Fair Value Gap (FVG) below the wick from August 5th.
In the world of technical analysis, FVGs represent areas where price moves rapidly in one direction, leaving a gap in liquidity that the market often revisits. These gaps are like magnets — they pull price back to fill them before the market continues in its original direction.
In this case, the FVG below the August 5th wick is significant. If Bitcoin revisits this area, we could see a long shadow — essentially, a sharp drop that quickly recovers — triggering a cascade of liquidations across the market.
This type of liquidity event could provide the fuel needed to push prices back up, potentially igniting a strong upward move.
However, it’s crucial to watch how price reacts at this level. If we see multiple HTF closures below $44K, it could indicate a break in the macro range and demand zone, which would be a bearish signal.
In such a scenario, the entire HTF structure could break down, confirming a bear market. While I see this as a low-probability event, it’s important to stay open to all possibilities — even those that don’t align with your primary view.
2. Confluence with USDT Dominance (USDT.D)
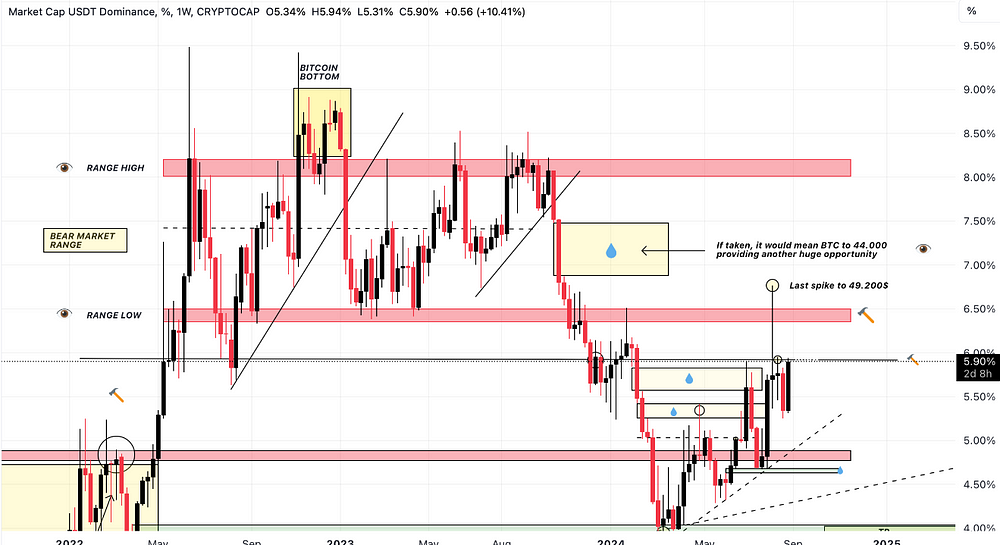
The second reason $44K is significant ties back to the USDT Dominance chart (USDT.D), one of my favorite charts for contextualizing Bitcoin’s movements.
If you look at the weekly chart for USDT.D, you’ll notice a similar FVG, marked by a rectangle with a droplet symbol. This FVG aligns perfectly with the one on Bitcoin’s chart.
What we want to see here is a quick spike in USDT.D, which would likely induce fear across the market, causing Bitcoin to dip into that $44K range.
This spike would target the imbalance between 7.00% and 7.40% on USDT.D, triggering a reversal that could push Bitcoin back up. However, just like with Bitcoin, if USDT.D closes inside this FVG, it could signal a return to the bear market range, which is why closures on both charts are so crucial.
Macro Perspective: Understanding the Bigger Picture
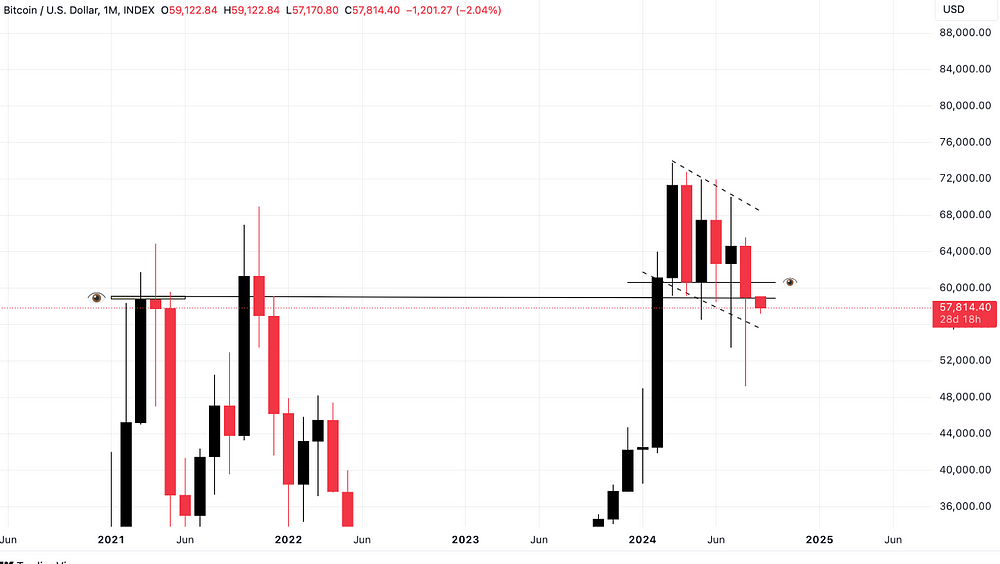
Now, let’s zoom out and look at the macro perspective. Yesterday’s August monthly closure at $59,015 raised concerns across the community, particularly because it broke through a cluster of four previous monthly candles. However, there are a few key points to keep in mind:
Retesting Critical Levels: The August closure essentially retested the March 2021 closure and the April 2021 open — two critical levels that help preserve the macro bullish structure. This retest, combined with the long wick that brought Bitcoin down to $49K, is reminiscent of the COVID-19 crash in 2020, albeit in a different context. The rapid absorption of this wick is a strong indication that the macro structure remains intact.
No Structural Breaks: Despite the bearish sentiment following the monthly closure, there were no structural breaks, meaning the long-term bullish outlook is still valid.
Daily Chart and Velodata: What to Watch Next
Moving from the monthly to the daily chart, we see that the last weekly candle closed below the previous week’s swing low (SL), suggesting more downside from a technical perspective.
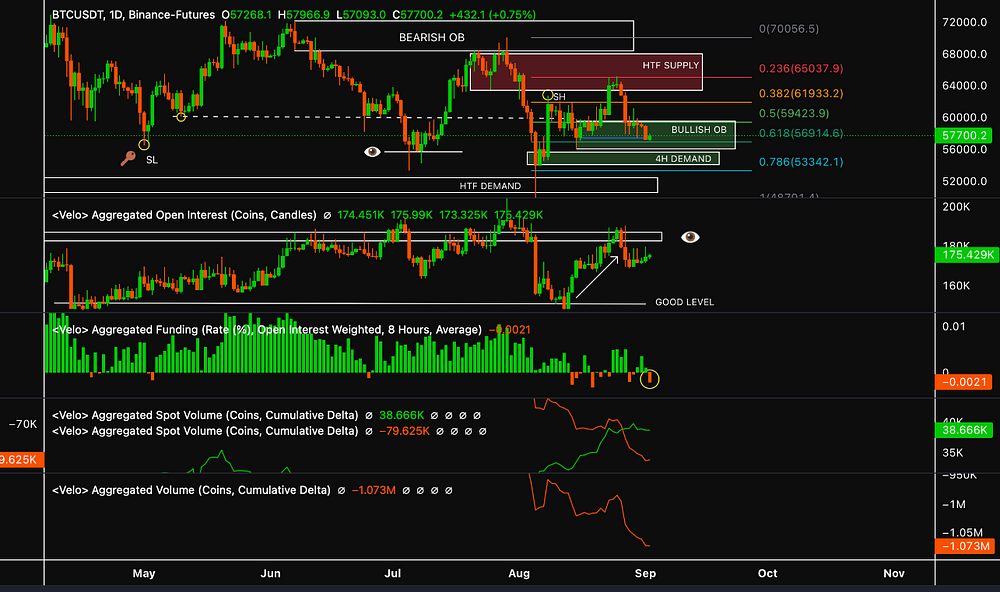
The first level to watch is the daily bullish Order Block (OB) around $56K (the low from August 15th). If Bitcoin doesn’t show a strong reaction at this level, the next area of interest is the 4H demand zone I identified on August 24th.
Another factor to consider is the open interest (OI) during this downturn. The slight increase in OI, combined with a negative funding rate, suggests that more short positions are entering the market. However, the OI hasn’t reached an “overheated” level, which makes me cautious — there might still be more downside before a reversal.
Key Levels to Watch
Based on all this analysis, here are the key levels I’m watching:
$56K: A potential reversal point.
$54K-$54.5K: Another area of interest if $56K doesn’t hold.
HTF Demand at $50K-$52K: Specifically, the $51K FVG.
USDT.D: Analyzing the Implications
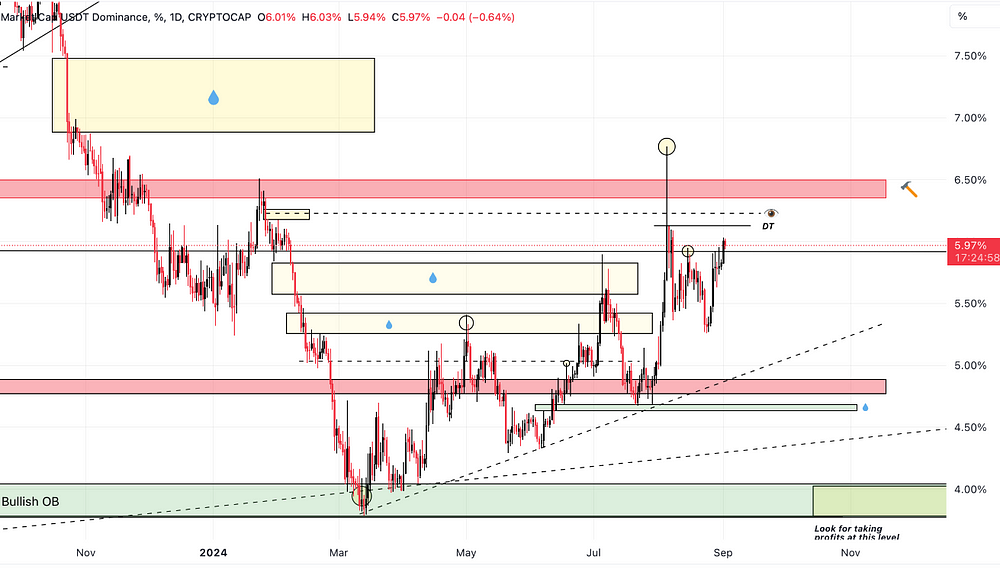
After initially rejecting the 5.90% level on USDT.D — indicated as a local bounce point for Bitcoin — USDT.D is starting to break above this level. This is crucial because higher levels, such as 6.13%, could serve as potential double tops (DT), corresponding with a possible double bottom (DB) on Bitcoin around $54K. Slightly above this, the daily FVG on USDT.D at 6.20% could send Bitcoin down to $51K, aligning with the FVG on the Bitcoin chart.
This confluence makes the $44K level on Bitcoin even more powerful for a potential reversal if reached.
Summing It Up: Strategic Positioning
While this is just one possibility, and every scenario must be evaluated step by step, placing an order around the $44K level could be a smart move if you’re looking to exploit this potential setup. These moves tend to be fast, often not allowing traders enough time to position themselves correctly, so being prepared is key.
My Current Outlook
Let’s recap where we are in this cycle from a broader perspective:
The Quick Rise: In previous cycles, it took 409 and 560 days to reach the range high after reclaiming it. This cycle, it only took 125 days, resulting in a rapid rally towards the range highs. Given this quick rise, some consolidation is not only expected but healthy.
The Halving Effect: The Bitcoin halving, which usually coincides with significant market movements, happened alongside the range-high breakout, adding to the consolidation we’re seeing now. This, combined with the lack of cooldown periods during the rally, is why I’m not concerned about the current slowdown.
Navigating the Chop: Over the past 180 days, we’ve seen numerous failed breakouts and breakdowns, leading many to get chopped up in the market. I’ve avoided this by sticking to a disciplined strategy — holding spot positions since 2023, taking profits during the initial 2024 rally, and adding more during key retests. Now, I’m patiently waiting for a breakout or breakdown before making my next move.
Strategic Planning for the Next Moves
As we move forward, I’m keeping an eye on the following scenarios:
Breakout: If we break out of the current range, I’m positioned to capitalize on the next leg up.
Breakdown: If we break down, I’ll watch for price action around the mid-range (0.5) or lower (0.25) levels, ready to adjust my strategy accordingly.
In any case, I’m not going to blindly predict the market. Instead, I’ll react to what the market shows me, especially in these critical zones.
Final Thoughts: Staying Adaptable
It’s important to remember that while each cycle has similarities, they also have differences. In this cycle, we’ve seen an earlier-than-usual rally driven by ETF speculation and positive inflows, leading to a longer consolidation period at previous highs. This doesn’t mean the cycle is over — it just means we need to stay adaptable.
By zooming out and remaining open to different scenarios, I’m positioning myself to navigate this cycle effectively, whether it means capitalizing on a breakout or patiently waiting through further consolidation.
In the end, the longer the accumulation, the stronger the expansion. This early run has extended the current consolidation, but it’s also setting us up for a much stronger move when the breakout finally occurs. So, while many are quick to declare that $74K was the top, I see it as just another step in the ongoing journey of this market cycle.
Your next step
Stay tuned to my next issue, where I will continue to give my insights on crypto + entrepreneurship to financial freedom!
Follow me on twitter (@healthy_we44554) and threads (@wise.healthy.wealth)

