When you’re dealing with Bitcoin, it’s easy to get caught up in the short-term price action.
The market’s day-to-day fluctuations can be intense, and it’s not uncommon to see significant price swings in just a matter of hours.
For many, this can be nerve-wracking, especially when your investments are on the line.
But here’s the thing: focusing solely on the short term can often lead to poor decision-making.
Instead, it’s crucial to step back and look at the bigger picture.
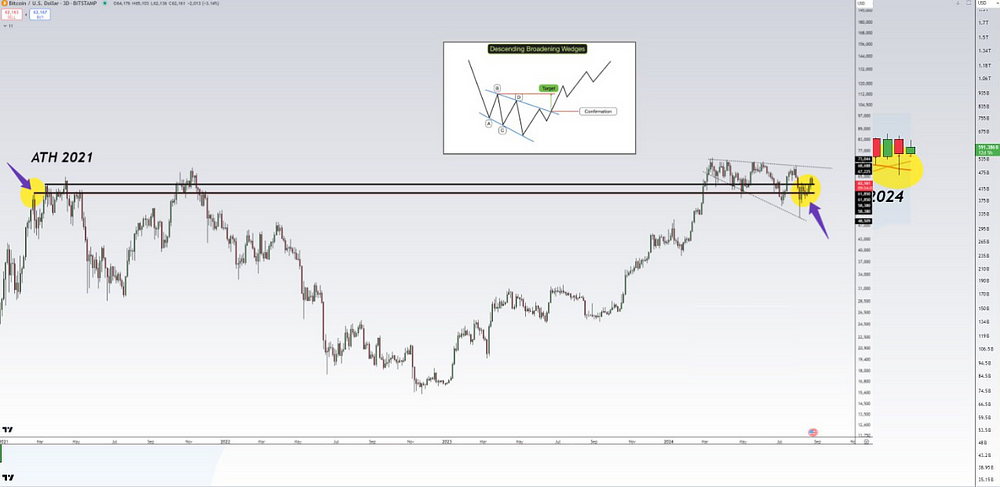
Chart 1: The Bigger Picture — 3 Day Chart

Let me illustrate this with a concept that’s particularly relevant to long-term Bitcoin holders: the 3-day (3D) chart.
This timeframe helps smooth out the noise that you see on shorter timeframes like the 1-hour or 4-hour charts.
By focusing on the 3D chart, you’re able to see the broader trends and structures that truly matter in the grand scheme of things.
Imagine you’re in a storm at sea.
If you only focus on the waves crashing around your boat, you might feel overwhelmed, even panicked.
But if you zoom out and consider your overall course, you can navigate through the storm with more confidence, knowing that the storm will pass and your destination is still within reach.
The same logic applies to Bitcoin’s price action.
Reclaiming Key Support Levels
Recently, Bitcoin has been reclaiming critical support levels, which is a positive sign for those of us with long-term positions.
Think of these support levels as the foundation of a house.
The stronger they are, the more stable the structure.
Bitcoin’s first key support level has already been successfully reclaimed, which indicates that the market has found a floor, at least for now.
Now, Bitcoin is attempting to establish support on the second black line — another critical level on the 3D chart.
If Bitcoin manages to hold above this line, it would further solidify the bullish structure that’s beginning to take shape.
Understanding Bullish Structure
So, what exactly is a bullish structure, and why is it important?
In technical analysis, a bullish structure typically refers to a pattern where the price consistently makes higher highs and higher lows.
This indicates a prevailing upward trend, suggesting that the asset is more likely to continue rising in value over time.
In the context of Bitcoin’s 3D chart, the current structure is showing signs of this bullish behavior.
After reclaiming the first support line, Bitcoin is now working to establish a higher low at the second support line.
If successful, this would suggest that the market sentiment is shifting from bearish to bullish, setting the stage for potential future gains.
Real-World Implications for Your Investments
Let’s bring this back to the perspective of a crypto entrepreneur.
If you’ve invested in Bitcoin, it’s likely because you believe in its long-term potential.
But during periods of volatility, it can be tempting to react impulsively to short-term price movements — selling when the price dips or buying when it spikes.
However, if you focus on the bigger picture and the overall bullish structure on the 3D chart, you’ll be better equipped to make informed decisions.
Instead of selling in a panic during a temporary dip, you might recognize it as a buying opportunity, especially if Bitcoin is holding above key support levels.
A Personal Example
I remember a time when Bitcoin was hovering around a critical support level on the 3D chart.
The market was incredibly volatile, and it seemed like every other hour there was news that could either send the price soaring or plummeting.
Many traders were panicking, selling off their holdings in fear of a major crash.
But by stepping back and looking at the 3D chart, I saw that Bitcoin was actually forming a bullish structure.
It had reclaimed a significant support level and was starting to consolidate above it.
Instead of selling, I decided to hold my position, trusting the larger trend.
A few weeks later, Bitcoin broke out of its consolidation and started a strong upward rally.
By staying focused on the bigger picture, I was able to ride that wave and significantly increase my investment.
The Power of Historical Patterns
When we look back at the history of the cryptocurrency market, certain patterns begin to emerge that can offer valuable insights into future trends.
One such pattern revolves around the behavior of altcoins, particularly when analyzed through the lens of the Relative Strength Index (RSI).
To understand where the market might be headed in 2024, let’s take a trip back to 2016 and compare it with what’s happening now.
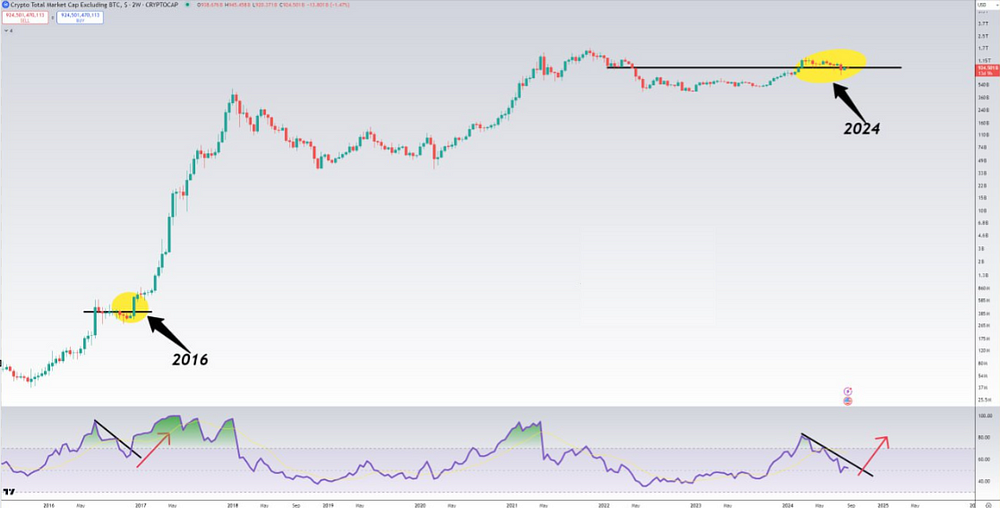
Chart 2: Total2 Crypto Minus BTC

In 2016, the crypto market was still in its early stages, but for those who were paying attention, the RSI was already painting an interesting picture.
The RSI, a momentum oscillator that measures the speed and change of price movements, was showing a falling trendline for many altcoins.
This trendline represented a period of consolidation and declining momentum.
However, as those who held their ground would soon find out, these falling lines didn’t last forever.
Fast forward to late 2016 and into 2017, and we saw those falling RSI trendlines break out upwards, leading to one of the most explosive altcoin bull markets in crypto history.
Altcoins that had been languishing suddenly skyrocketed, delivering astronomical returns to those who had the foresight to see the breakout coming.
Drawing Parallels: 2016 vs. 2024
Now, let’s bring it back to the present.
As we move through 2024, we see a similar pattern forming on the RSI charts for many altcoins.
Just like in 2016, the RSI is showing a falling trendline, indicating a period of consolidation and reduced momentum.
This can be discouraging for some, especially those who are new to the market or who haven’t experienced the cyclical nature of crypto before.
But if history is any guide, this falling trendline is not a cause for alarm — it’s a setup for something much bigger.
The key here is patience.
The market cycle we’re in now is playing out on a much larger timeframe than what we saw in 2016/2017, but the underlying mechanics remain the same.
Eventually, these falling lines on the RSI will break out upwards, just as they did before, setting the stage for another massive altcoin rally.
The 2016/2017 Altcoin Boom: A Case Study
Let’s revisit the 2016/2017 altcoin boom to understand what might be in store.
During this period, the altcoin market was marked by rapid price increases across the board.
Coins like Ethereum, Ripple, and Litecoin saw their values increase by hundreds or even thousands of percent within months.
This wasn’t just random chance; it was the culmination of a longer-term trend that began with the breakout of falling RSI trendlines.
Investors who had the insight to recognize these signals were able to enter the market before the real explosion occurred, riding the wave to substantial profits.
One of the key takeaways from this period is that those who focused on the larger timeframe, rather than getting caught up in short-term fluctuations, were the ones who benefited the most.
The same principle applies today. The timeframe might be larger in 2024, but the potential for significant gains remains, provided you have the patience to wait for the right moment.
Applying the 2016/2017 Lessons to 2024
As a crypto entrepreneur and investor, understanding these historical patterns can give you a significant edge.
The RSI is a valuable tool in your arsenal, but it’s most powerful when combined with a broader understanding of market cycles.
Here’s how you can apply these insights:
Monitor the RSI on Longer Timeframes: Focus on the weekly or even monthly RSI for altcoins you’re interested in. Look for falling trendlines that have been forming over a prolonged period.
Stay Patient During Consolidation Phases: It can be tempting to sell or switch assets when prices stagnate, but remember that consolidation phases often precede major breakouts. If the RSI trendline starts to show signs of breaking upwards, it could be the precursor to a new bull market.
Diversify Your Portfolio: Just as in 2016/2017, not all altcoins will perform the same way. By diversifying across a range of promising projects, you increase your chances of catching the next big mover.
Think Long-Term: The market in 2024 is moving on a larger timeframe, meaning that while the rewards can be substantial, they may take longer to materialize. By keeping your focus on the long-term trends, you can avoid the pitfalls of short-term thinking and position yourself for greater success.
Back in 2016, I was one of those investors who watched the RSI closely. I saw the falling trendlines and knew that a breakout was likely, even though the market was quiet at the time.
By taking positions in several promising altcoins, I was able to ride the wave when the breakout finally happened.
The experience taught me the value of patience and the importance of looking at the bigger picture.
Now, in 2024, I’m seeing similar signals. The timeframe might be bigger, but the fundamentals are the same.
I’m confident that we’re on the cusp of another altcoin boom, and I’m positioning myself accordingly.
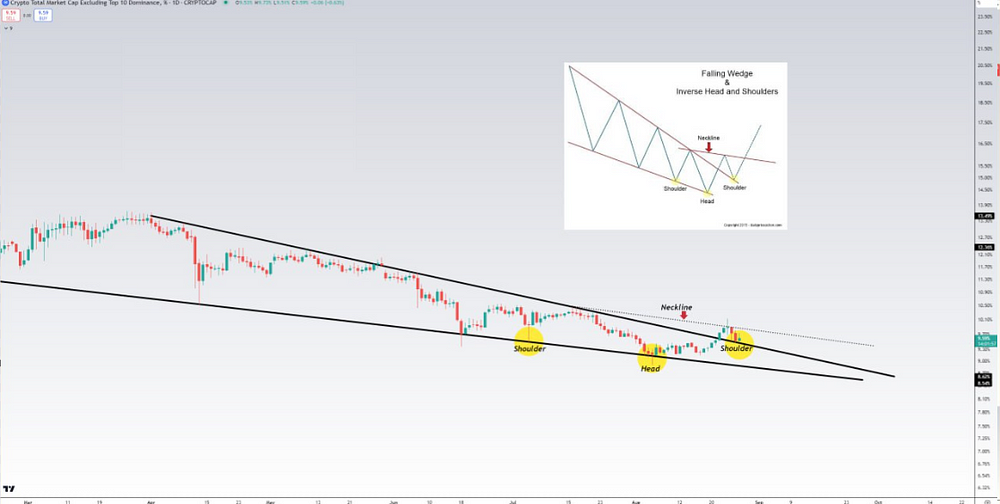
Chart 3: Altcoin Market Cap

Selling your altcoins at the very moment they’re breaking out of a 9-month falling wedge is like abandoning a ship just as it’s about to set sail.
The irony is palpable. If you’re familiar with technical analysis, you’ll know that a falling wedge pattern — especially one that has been forming over such a long period — is often a precursor to a significant price rally.
So, why would anyone choose to sell at this critical juncture?
Let’s break down what’s happening here and why this might be one of the worst times to exit your positions.
The Power of the Falling Wedge
First, let’s talk about the falling wedge pattern. For those who might be new to this, a falling wedge is a bullish chart pattern that occurs when the price is moving in a downward trend, but the range between the highs and lows narrows over time.
This pattern usually indicates that the selling pressure is subsiding, and a breakout to the upside is imminent.
When you see a 9-month falling wedge, you’re looking at a significant period of consolidation, where the price has been tightening and preparing for a potential breakout.
The longer the wedge, the more powerful the breakout tends to be when it finally occurs.
So, if your altcoins have just broken out of such a pattern, it means that the market is likely shifting from bearish to bullish, and the upside potential could be substantial.
The Inverse Head and Shoulders: A Double Bullish Signal
Now, let’s add another layer to this analysis — the inverse head and shoulders pattern.
This is another classic bullish pattern, characterized by three troughs, with the middle one being the lowest (the head) and the other two being higher (the shoulders).
The neckline, which connects the peaks between these troughs, serves as a key resistance level. When the price breaks above this neckline, it typically signals a strong upward move.
Seeing an inverse head and shoulders pattern forming just as the price breaks out of a 9-month falling wedge is like having two green lights at the same intersection.
It’s a rare and powerful combination that can amplify the potential for a significant price increase. In short, this is the kind of setup that traders dream about.
Why Selling Now Could Be a Mistake
So, imagine selling your altcoins at this moment — just as they’ve broken out of a falling wedge and are potentially confirming an inverse head and shoulders pattern.
It’s like leaving a party just as the music starts playing.
Sure, the market might be retesting the breakout level right now, and that could cause some short-term volatility, but this is a normal part of the breakout process.
During a retest, the price often revisits the breakout level to confirm it as a new support.
This is not a sign of weakness; rather, it’s a healthy part of establishing a strong base for the next leg up.
Selling during this retest is like second-guessing the market at the worst possible time, potentially missing out on the explosive gains that could follow.
Final Thoughts (3 Charts Together)
The key takeaway here is not to get lost in the short-term noise.
Selling your altcoins just as they’ve broken out of a 9-month falling wedge and are retesting the breakout level could be one of the biggest mistakes you make as an investor.
The combination of a falling wedge breakout and an inverse head and shoulders pattern is a powerful bullish signal that suggests the market is on the verge of a strong upward move.
Instead of selling, consider holding your position or even adding to it, depending on your risk tolerance and confidence in the setup.
Trust the technicals, manage your risk, and be patient — this could be the beginning of a major rally, and you don’t want to miss out on the potential gains.
While it’s essential to stay informed and monitor the market, your primary focus should be on the broader trends and structures that dictate the long-term direction of Bitcoin.
The 3D chart is a valuable tool in this regard, helping you see past the day-to-day fluctuations and understand where Bitcoin is likely headed.
By recognizing the importance of reclaiming key support levels and the formation of a bullish structure, you can make more confident decisions that align with your long-term investment strategy.
So, next time you feel the urge to react to a sudden price movement, take a deep breath, step back, and look at the bigger picture.
More often than not, this perspective will guide you toward better outcomes in the world of crypto investing.
The RSI is more than just a technical indicator; it’s a window into the market’s underlying momentum.
By understanding its patterns and applying lessons from the past, you can make informed decisions that align with the larger market cycle.
Altcoins have the potential to repeat the explosive growth we saw in 2016/2017, and while the timeframe is bigger, the opportunity is just as real. Keep your eyes on the RSI, stay patient during consolidation phases, and be ready for the breakout when it comes.
The next altcoin bull market could be just around the corner, and with the right approach, you can be there to capitalize on it.
If you’re serious about building wealth, especially in the crypto space, I encourage you to follow a proven strategy, stay disciplined, and avoid the hype. The road to financial freedom isn’t paved with shortcuts — it’s built on solid foundations. And I’m here to help you lay those foundations, one step at a time.
Your next step
Stay tuned to my next issue, where I will continue to give my insights on crypto + entrepreneurship to financial freedom!
Follow me on twitter (@healthy_we44554) and threads (@wise.healthy.wealth)

