- Digital Vault
- Posts
- What Happens To Altcoins When BTC Hits ATH? — Let The Indicators Speak
What Happens To Altcoins When BTC Hits ATH? — Let The Indicators Speak
It feels like we’re still stuck in a $60K market, especially when you zoom in on altcoins.
Sentiment across the space is low, confidence is shaky, and outside of some cabal-backed memecoins, the broader altcoin market is struggling to catch a bid. But here’s the thing: if history tells us anything, this is a familiar part of the cycle.
We’re going to rewind to the 2021 altseason to see what might be coming next for alts in this cycle. Buckle up, because what we’re about to uncover will get you excited for the months ahead. Let’s dive in. 🧵👇
Alright, now that we’ve got that out of the way, here’s something you need to know — it’s been 169 days since the last Bitcoin halving. If you compare that with the previous cycle, this is where $BTC and the broader crypto market were on October 27, 2020.
So, what happened next after this point in 2020?
I’ll give you a hint: it was nothing short of explosive. Keep reading, and I promise, you’ll be shocked.
Let’s Talk Bitcoin: What Happened in 2020?
1) Bitcoin ($BTC):
On October 28, 2020, Bitcoin was trading at a modest $13.6K, down about 30% from its previous all-time high. The market was cautious, and sentiment was weak — much like today. But here’s where things get interesting. Less than 6 weeks later, Bitcoin smashed through its old ATH and was on its way to unprecedented heights.
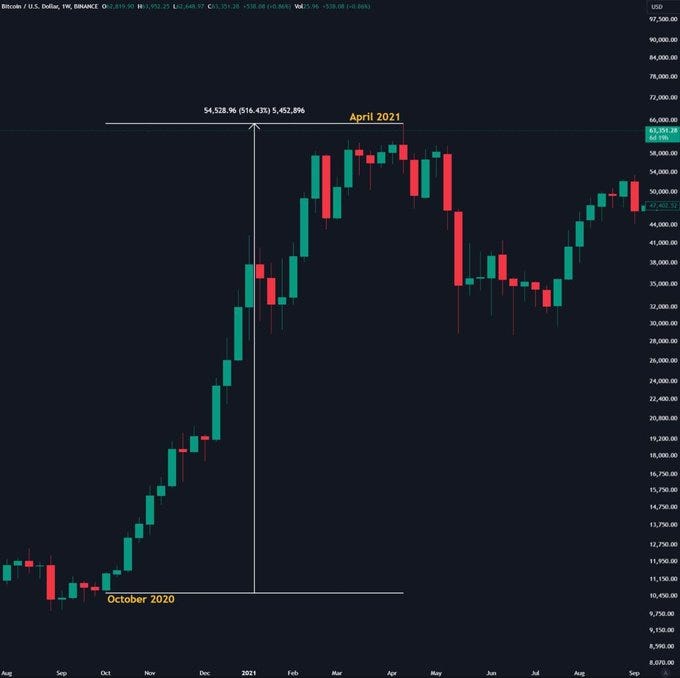
4.5 months after that, Bitcoin hit $61.5K, marking an insane 370% gain in a very short time.
Now, let’s apply that kind of momentum to today. If $BTC even manages to achieve 50% of that rally, we’re looking at a new ATH by November and potentially seeing Bitcoin hit $170,000 by March 2025. The clock is ticking, and the signs are already there.
Ethereum’s Meteoric Rise: Are We Repeating History?
2) Ethereum ($ETH):
Ethereum’s journey is just as compelling. On October 28, 2020, $ETH was trading at a humble $400, which was down a massive 72% from its previous ATH. Fast forward just 3 months, and Ethereum had blasted past its ATH, delivering a whopping 275% gain.
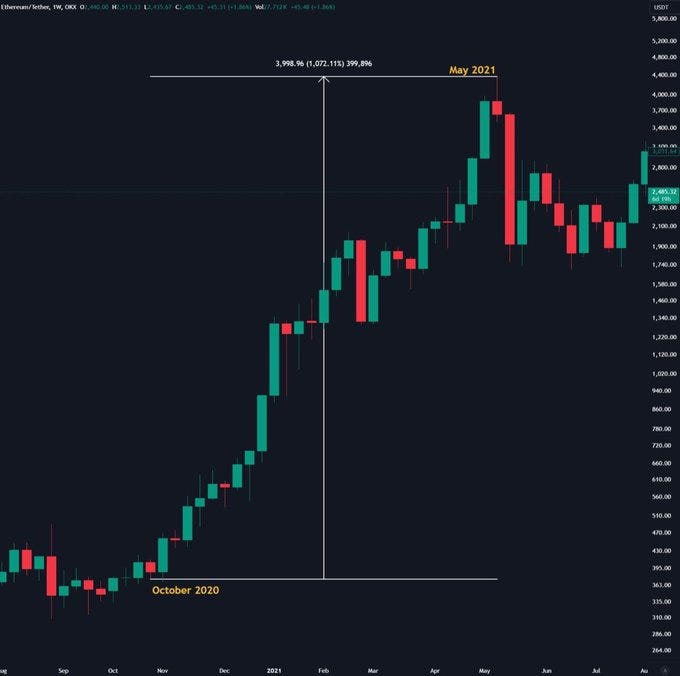
By May 2021, $ETH reached a staggering $4.6K, marking an 11.6x pump in just 7 months.
Where does that leave us today? ETH is down roughly 55% from its ATH, and as some are calling for its downfall, I can’t help but chuckle. Those making these claims clearly haven’t studied Ethereum’s history. The past cycles have shown us that ETH tends to slingshot from these lows right when everyone least expects it. Are you ready for the next wave?
Altcoin Market Cap: The Calm Before the Storm?
3) Total Altcoin Market Cap (Excluding ETH):
Let’s take a step back and look at the entire altcoin market, excluding Ethereum. On October 28, 2020, the total altcoin market cap sat at $102 billion, down 72% from its peak. Sound familiar? This was the calm before the storm.
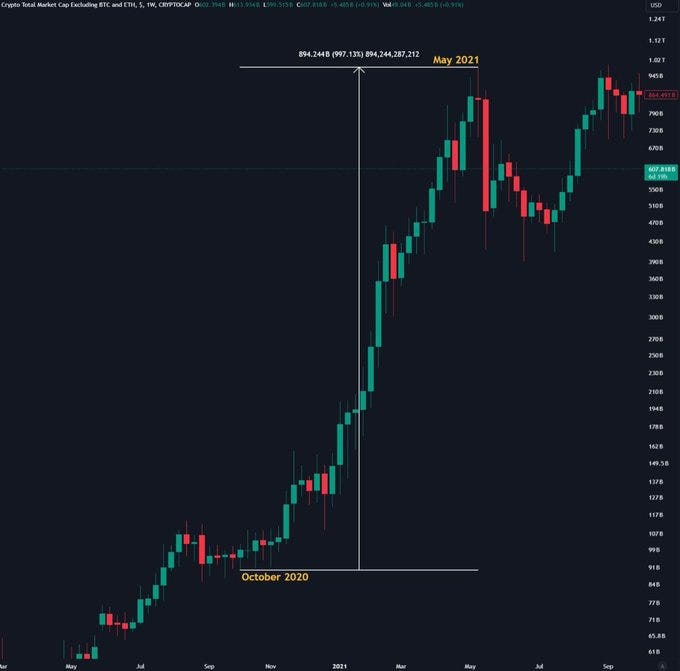
Just 3.5 months later, the total altcoin market hit a new ATH, and the altseason was officially on. By May 2021, the market cap had skyrocketed to $1.1 trillion, marking a jaw-dropping 11x gain in just 7 months.
Today, the total altcoin market is down 47% from its ATH. If history repeats itself, we’re standing on the precipice of another face-melting altseason. If you’re not already positioning yourself, you might want to reconsider.
The Top Performers: Where Were They in 2020?
Now that we’ve gone through some of the most critical charts, it’s pretty clear that we haven’t even scratched the surface of the next mega rally. Let’s rewind to October 2020 and look at some of the top-performing assets from the last cycle and see where they were trading back then.
Fantom ($FTM): The Layer 1 Juggernaut
On October 28, 2020, $FTM, one of the best-performing Layer 1s of the last cycle, was trading at $0.021, having dropped 40% in just a single week. Sound bleak? That’s just part of the game in crypto. But those who stuck around were rewarded handsomely.
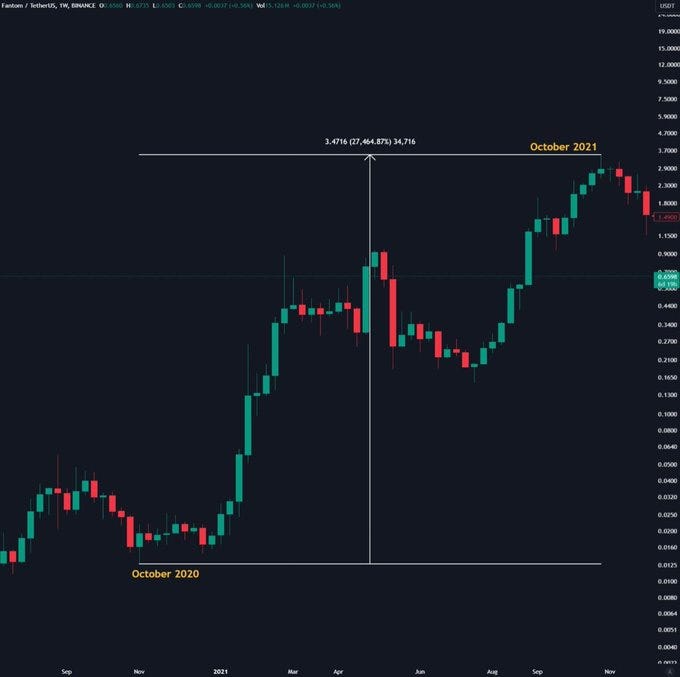
By January 2021, $FTM was still trading in the same range. Then, out of nowhere, it pumped 2,800% in just one month. By October 2021, $FTM hit $3.5, marking an incredible 11,500% gain in 9 months.
Polygon ($MATIC): The Ultimate Underdog Story
You think $FTM was crazy? Wait until you hear about $MATIC (now known as Polygon). On October 28, 2020, $MATIC was trading at just $0.015, and it had dropped 20% over the previous three days before bottoming out. Not exactly promising, right?
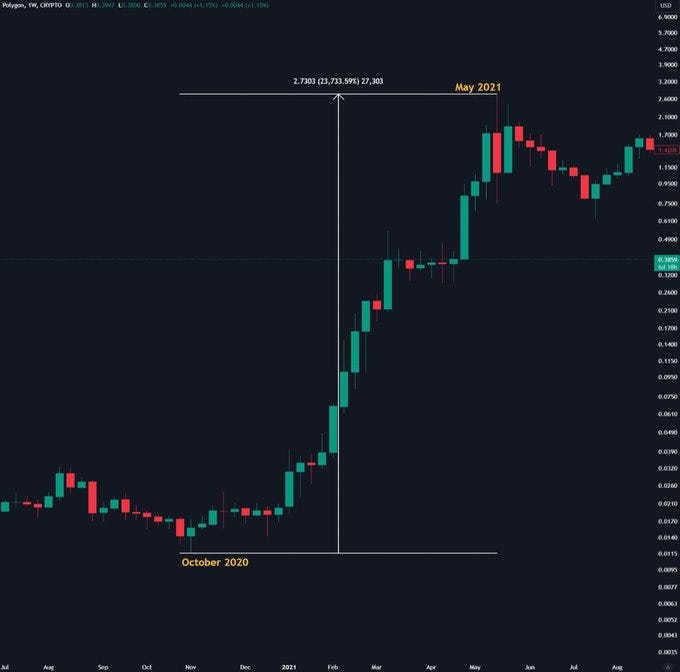
But by January 2021, $MATIC had already doubled in price. And that was just the beginning. By May 2021, $MATIC had pumped a mind-blowing 163x. Imagine putting just $10,000 into $MATIC in October 2020 — you’d have been sitting on $1.6 million just 7 months later.
Dogecoin ($DOGE): From Meme to Mania
Who can forget the GME mania, Elon Musk’s tweets, and the subsequent $DOGE explosion? On October 28, 2020, $DOGE was trading at $0.003, having dropped 35% over three days. But then came the GameStop saga.
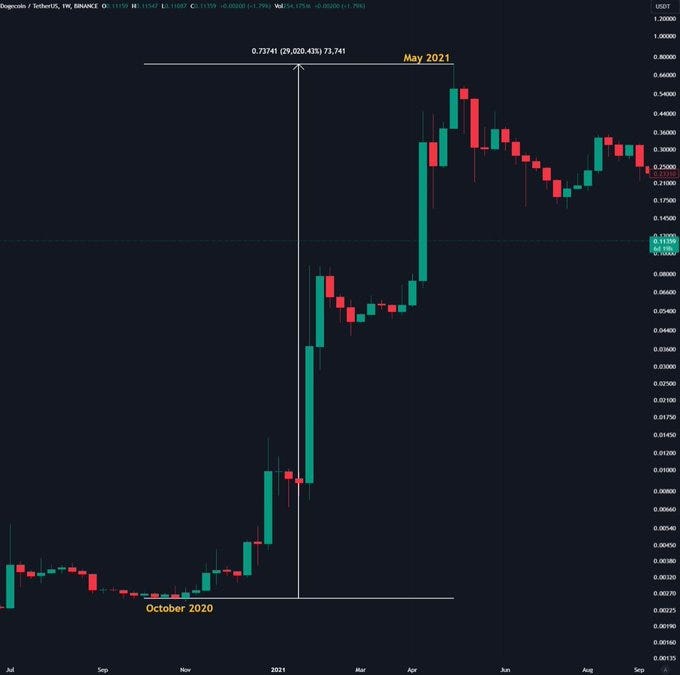
On January 28, 2021, $DOGE pumped 1,000% in one day. Yes, you read that right — 1,000% in a single day. But it didn’t stop there. By May 2021, $DOGE was trading at $0.74, delivering a mind-boggling 24,500% return in just 6.5 months.
Shiba Inu ($SHIB): The Dog Coin Sensation
Last cycle wasn’t just about $DOGE — enter $SHIB. On October 28, 2020, $SHIB was trading at an absurdly low $0.00000000008245. Over the following weeks, it dropped another 40%, but by May 2021, $SHIB had hit $0.00003532, marking an astronomical 42,000x gain.

If you had put just $10 into $SHIB in October 2020, you’d have walked away with a cool $10 million by November 2021.
Other Crazy Gains from 2020–2021
And it wasn’t just these coins that popped off. Let me hit you with some more insane stats from the last cycle:
$GALA: 2,840x in 12 months
$AXS: 1,170x in 11 months
$SOL: 170x in 11 months
$HNT: 87x in 11 months
$AR: 45x in 10 months
Alts like $BNB, $AVAX, $FIL, $SAND, and $MANA also pulled 20x-50x gains in less than a year.
But Is This Cycle Different?
People always say, “This cycle is different.” But you know what? They say that every single time, and it ends up playing out the same way. Yes, we saw $BTC hit a new ATH before the halving due to the ETF hype. But everything else? It’s the same pattern.
After every halving, we see consolidation, $BTC dominance rises, and alts take a breather. Historically, altseason doesn’t kick off until Q1 after the halving year. That means there’s still time to accumulate before the next wave hits.
My Bold Predictions for This Cycle
Call me a permabull if you want, but here’s what I’m forecasting for the rest of this bull run:
$ETH: $1.5T to $2T market cap by cycle peak
At least two Layer 1s will hit $300B+ market caps
Memecoins will peak at $600B-$800B, with a few hitting $100B+ caps
One AI coin will hit $80B+, with others reaching $40B-$50B
The overall crypto market cap will peak at around $9.5T-$10T
Remember, this doesn’t mean I’m waiting for the pico top to sell. But it does mean I’ll keep a moonbag rather than cashing out entirely.
If you’re serious about building wealth, especially in the crypto space, I encourage you to follow a proven strategy, stay disciplined, and avoid the hype. The road to financial freedom isn’t paved with shortcuts — it’s built on solid foundations. And I’m here to help you lay those foundations, one step at a time.
Your next step
Stay tuned to my next issue, where I will continue to give my insights on crypto + entrepreneurship to financial freedom!
Follow me on twitter (@Digitalvault1)